a visual experiment done in a kind of desperation, created out of light and data and forms taken from the synchrotron… if only this kind of thing could happen in realtime.
anyway, I’m escaping to Perth to go do the ANAT Domelab workshop.
click image to see animation

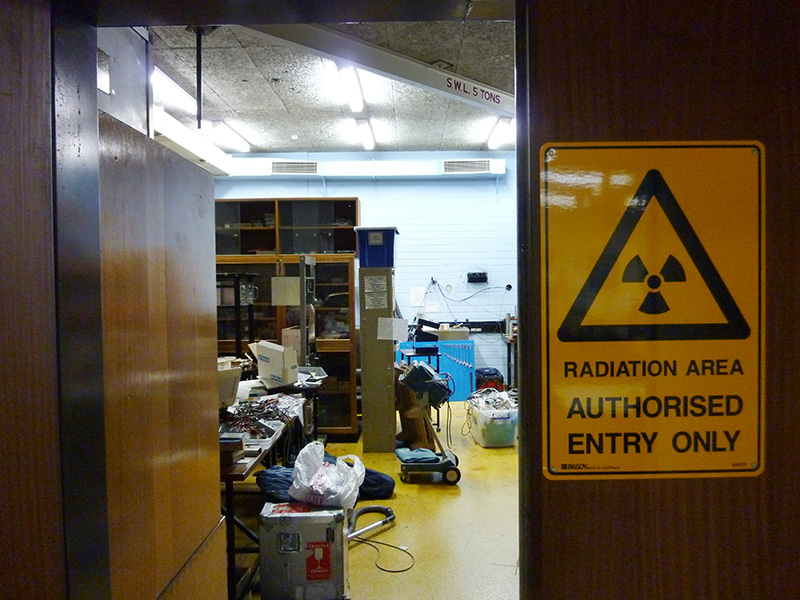
I have spent the last few weeks in the basement of the Physics building at Melbourne Uni.
Why?
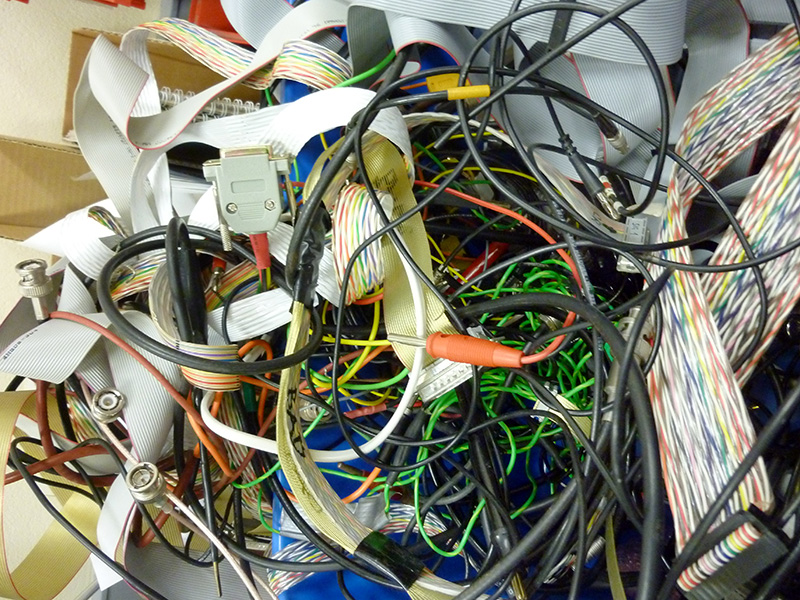
Now I’m not so sure, at the time there was talk of learning MATLAB in an easier-to-get-to location. Since then there has been a lot of interesting discussion with some of the other people down here in terms of the what/how/why of my project. I have done a few matlab tutorials and learned a few basic graphing functions. But it would take at least a science degree to learn it properly. But there are other projects going on down here too, lots of things flying around in the air. And there is so much stuff all around on every surface, like being in the mind of a mad scientist. But then there is the saying – a clean desk is the sign of a sick mind. It is a very different space from the sterile sci-fi future-world at the synchrotron. It gives me ideas about energy, fields and entanglement, whilst entangling my ideas like a whorl of cables.


The other day I brought in about 20 dancers, improv jazz musicians, piano players, painters, dramaturges etc; students from my ‘Art vs Science’ & ‘Art + Science’ seminar groups at the VCA (Victorian College of the Arts). Mark Boland & Kent Wooton showed them around the complex, with lots of sightseeing and discussions along the way. The students recorded their feelings and responses to the experience via questionnaires I gave them (which will be collated sooon). This is a big part of my experiemnt – what happens when artists and scientists collide? What I can say now is that there were a few surprise insights and bending of minds, on both sides of the art vs science spectrum.


Beamcircle extract 1 : Click on this link to access an extract from the first animation directly created from the synchrotron light and data outputs. The animation has not been retouched or edited – the form and movement is directly created from the algorithms and ‘data palette’ described below. It should be a ‘realtime’ animation but, ironically indeed, although the data is streamed out of the ring in milliseconds /microseconds / picaseconds, it takes about 10 seconds to render each frame of the animation, so this 30 second extract shows 2.5 hours of activity in the synchrotron ring.
(I feel I am allowed to use the word ‘random’ because there’s quantum stuff happening just around the corner. Only on the quantum scale does randomness truly exist, and you can see its effects in the graphic readouts from the matlab interface, such as in the images below.)
I have spent half my time totally failing to learn some basic matlab imaging techniques, and the other half walking around in circles (the facility is just a big circle). Half of that time was spent on a mission to petition some of the scientists to obtain an official licensed science version of photoshop for use as a diagnostic tool, which I can then use with matlab. Frustrating but kinda interesting, trying to introduce photoshop into this world. But will it be easier than trying to reinvent photoshop using physics software?…

The ‘live camera obscura’ beam image (directly above) is magnified 100 times, and is thus pixellated – the electron beam is a few mm in diameter, but is unimaginably bright. The ‘camera obscura camera’ only records light intensity, so the color is artificial, using one of the standard scientific coloring systems that maps different brightness levels to different hues. This itself is interesting, as these coloured mappings are fairly standard across scientific programs. The decision by the scientists as to use one palette over another is not formally standardized. Perhaps the scientists’ choice of which palette to use is totally subjective, based on personal scientific aesthetics as to which the scientist likes the best, and / or what sort of science or experiment it is, and / or what mood the scientist was in at the time etc etc … The matlab supported colormap palettes are called ‘Jet’, ‘HSV’, ‘Hot’, ‘Cool’, ‘Spring’, ‘Summer’, ‘Autumn’, ‘Winter’, ‘Gray’, ‘Bone’, ‘Copper’, ‘Pink’, and ‘Lines’.
_____________________
Being ‘in the zone’ (what some people academically described as ‘Flow theory’) seems to be similar when physicists are trying to work out some complex problem as when artists are in the middle of working on a piece. It’s a different level / type of consciousness is in use. It also has an adverse effect when you’re suddenly faced with social interaction i.e. it prevents you from having a normal conversation because you can’t talk proplerly. It sounds like ‘bzbzbzbzbzzttztztztzttttt’ in your head. Yes, this is verified by scientists too.
_____________________
Perhaps it’s counterintuitive, but is sound more real (physical) than light?
Is sound more like 360 degree X-ray vision, or perhaps like seeing fields?
I asked this to the ticket spook on the train, and he thinks light is more physical than sound “cos you can see things with light”. But you can hear ‘more’ things with sound i.e things you can’t see… But then of course you can see things you can’t hear…
Today I began tweaking the variables coming out of the storage ring and adjusting the equations, attempting to create an image automation process that ‘feels’ more like the accelerator effects than I get from the graphic data…
The image below is what Mark calls my ‘data pallette’. It contains 6 variables of data mapped on 3 graphs, the ‘camera obscura’ beam image and intensity map, and my ‘Lightbridge 101’ visual mix of it all: